A Product Segment Report gives you data on the performance of products across two segments like Revenue vs. View. Based on how visitors engage and generate revenue on products, this data is segmented across 30 days to segment products into 4 buckets - 'High Potential', 'Low Potential', 'High Exposure', and 'Low Exposure'. These reports are calculated for all the products in stock from your product catalog for a period of 30 days.
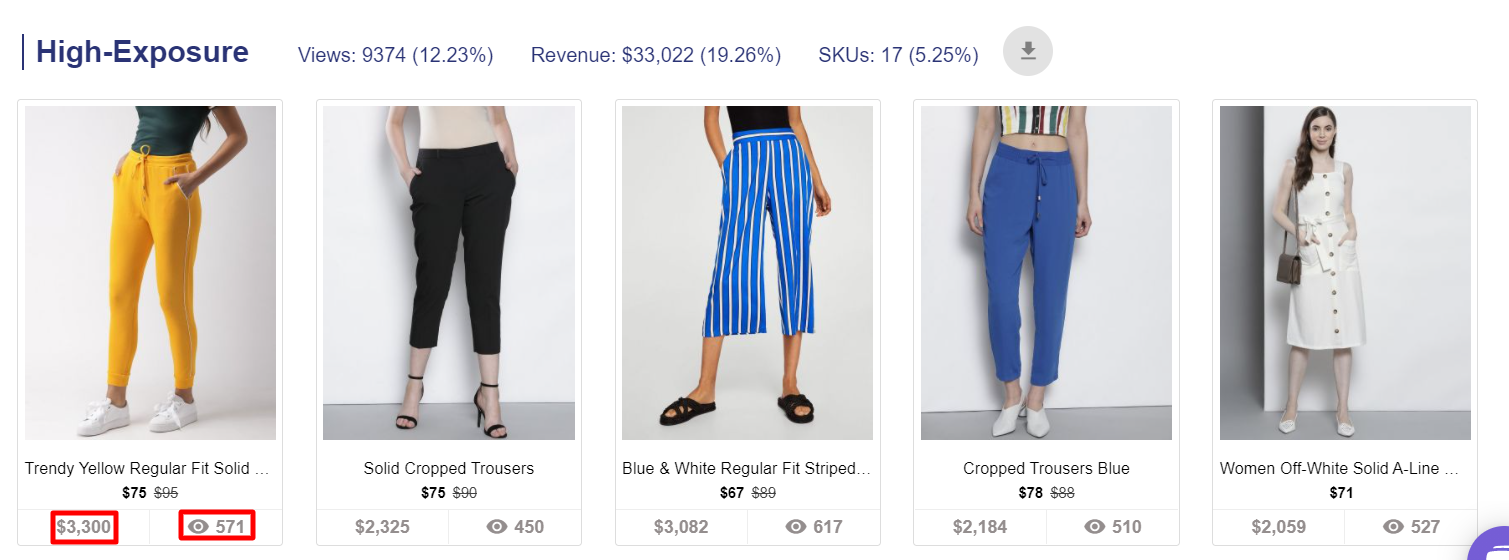
'High Exposure' products are the ones that have a higher number of product views for each product, with a corresponding high revenue. These products have the potential to continue generating more revenue with more exposure. These are safe bets to make.
'High-Potential' products are the ones that have a higher than average revenue per product view, across the in-stock product catalog based on the last 30 days. These products have the potential for generating higher than average revenue per view, with more visibility. These are good bets to make. 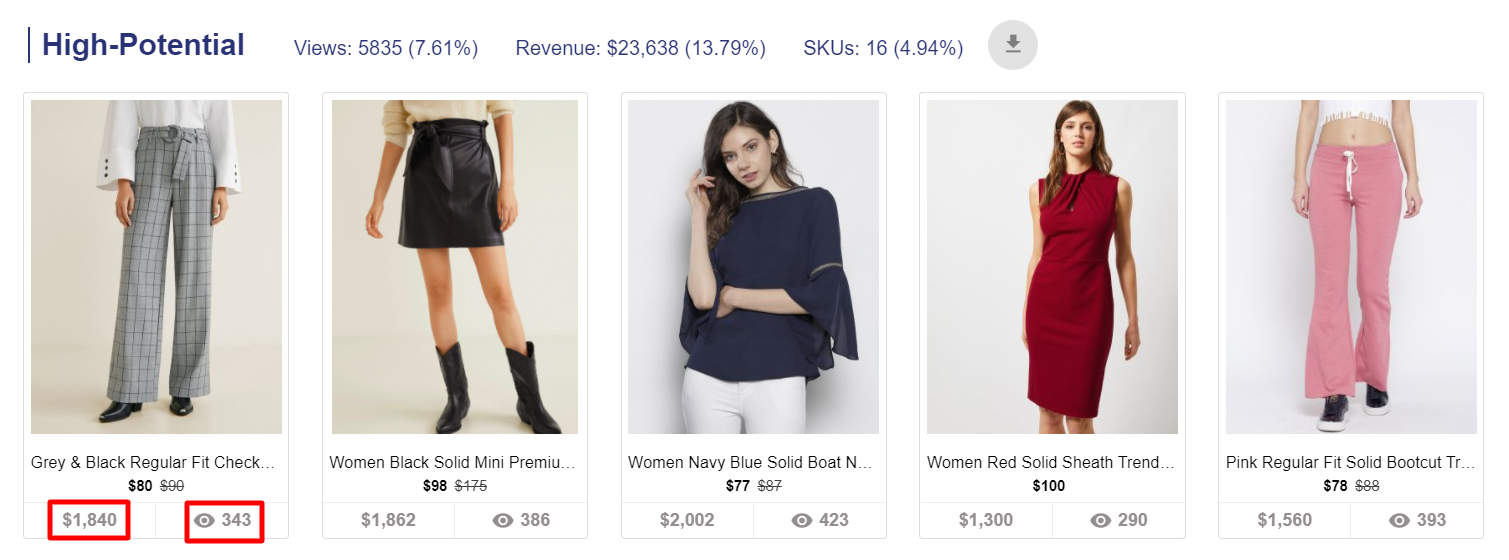
'Low-Potential' products are the ones that have lower than average revenue per view. These products increase the cost of customer acquisition and lower profitability, as they are not selling equivalent to the visitor engagement on the products. These products are bad to bet on in their current state. 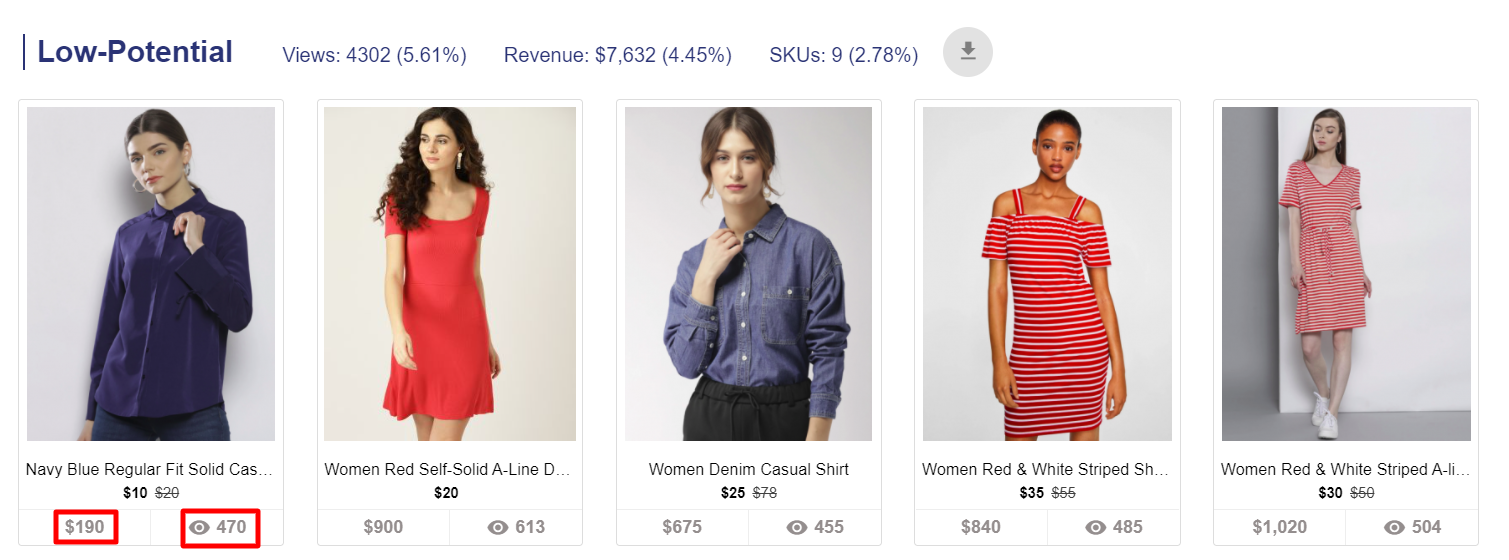
'Low-Exposure' products are typically those that lie after the 3rd or 4th-page scroll. While there are product views and revenue associated with these products, the correlation between the two segments is not defined and sporadic. There is not enough correlated data to make any bet on this segment. 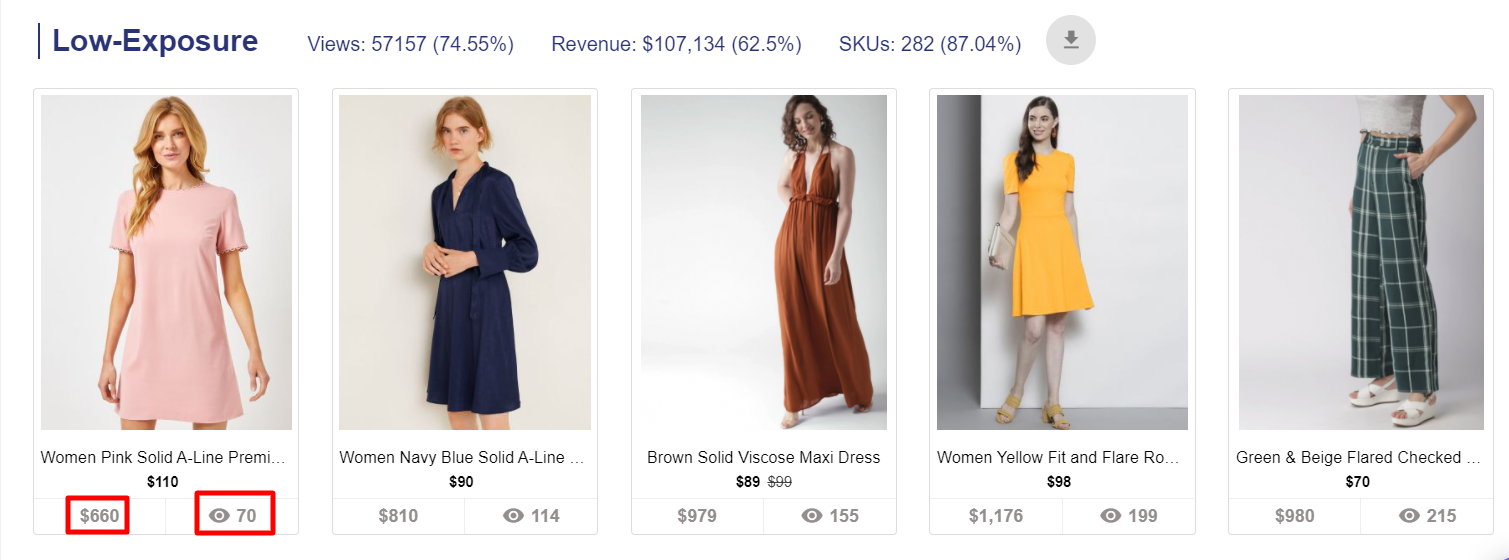
The Value Proposition: Use visual data to understand product performance
The Product Segment report gives merchants one more view of how visitors engage with the products, which can be used in category or search merchandising to influence business performance. By prioritizing the placement of products that have been viewed more and bought more, you are helping your customers spend less time on product pages that they may not purchase from. Since this data comes from the past 30 days, it gives you an idea about the most recent performance trend of a product.
To know more about Product Segment reports, click here.
To learn about how to apply these reports to your business, set up a free onboarding session using this link.